Protein name:Lysosomal cobalamin transporter ABCD4
Disease:Methylmalonic aciduria and homocystinuria type cblJ (MAHCJ) , Methylmalonic aciduria and homocystinuria type cblJ (MAHCJ)
Move
over
The PirePred server
is an interpretation tool designed for clinicians interested in the genotype/phenotype relationships of clinical variants found in 58 genes related to conditions investigated in neonatal screening programs.
Missense, nonsense and frameshift single nucleotide variants (SNVs) annotated in the ClinVar database are retrieved in real time and presented in the structural context of the original protein. For each variant, binary classifications (Benign/Pathogenic) obtained from 15 popular predictors are shown, together with a consensus ternary classification (Benign/VUS/Pathogenic).
Alternatively, you can also see predictions for all possible single amino acid variants (SAVs) arising from SNVs in these genes.
Disclaimer. This resource is intended for research purposes only. PirePred classification is computational supporting evidence as defined by the ACMG guidelines. The authors are not responsible for its use or misuse and assume no liability or responsibility for any error, weakness, incompleteness or temporariness of the resource and of the data provided.
Citation. If you find PirePred helpful for your research, please cite the following article: Galano-Frutos JJ, García-Cebollada H, López A, Rosell M, de la Cruz X, Fernández-Recio J, Sancho J. (2022). PirePred: An Accurate Online Consensus Tool to Interpret Newborn Screening Related Genetic Variants in Structural Context. J. Mol. Diagn. 24(4): 406−425. DOI: 10.1016/j.jmoldx.2022.01.005
Loading data, please wait...
FINANCIACIÓN/FINANCEMENT FEDER
Proyecto Cofinanciado al 65% por el Fondo Europeo de Desarrollo Regional (FEDER) a través del Programa Interreg V-A España-Francia-Andorra. Projet Co-financé à hauteur de 65% par le Fonds Européen de Développement Régional (FEDER) dans le cadre du Programme Interreg V-A Espagne-France-Andorre.
Animation 1. PirePred server’s Main Screen and functionality of the Main Selection Panel.
The PirePred server’s Main Screen offers the user the possibility to select −through the Main Selection Panel (Animation 1)− either one gene, protein or disease among 58 frequently investigated ones in neonatal screening programs.
The entries in each of the three selection modes are listed alphabetically (Animation 1).
When a gene, protein or disease is chosen in the Main Selection Panel ([1] in Animation 2), all the associated Single Nucleotide Variants (SNVs) reported to date in the ClinVar database are retrieved
and depicted in the Variants Panel ([2] in Animation 2). Likewise, a link to predictions of all possible amino acids variants from ClinVar's SNV entries is given in this panel (also available at the Buttons band at the right-hand part of the server screen). At the same time, the structure of the concerned protein is shown in the JSmol Structure Visualization Panel ([3] in Animation 2) in its reported or modeled biological assembly.
At the top of this panel, a self-explanatory text indicates whether the structure has been experimentally determined or it is a model, provides a link to the coordinates file stored in the Protein Data Bank (for experimentally solved structures), and indicates its sequence coverage (the residues of the protein that are shown in the structure).
Additional information on the protein structure shown in Panel 3, as the elucidation method (X-ray, NMR or Cryo-EM), the resolution, the missing residues (if any), the sequence coverage, the server
used to model (by homology or threading) the protein structures (or fragments of them) not experimentally solved, and some quality parameters of the models, is poured into the ‘Structure/model
information’ button () placed at the Buttons Side Band ([4] in Animation 2). Also, a ‘Help/Credits’ button (
) allowing the user to access this text appears on that band. By clicking one out of the SNV buttons in Panel 2 (e.g.
) the cartoon representation of the protein in Panel 3 zooms out and centers at the affected residue, which is labelled
and highlighted in green.
Animation 2. Interactive panels containing the main functionalities in the PirePred server.
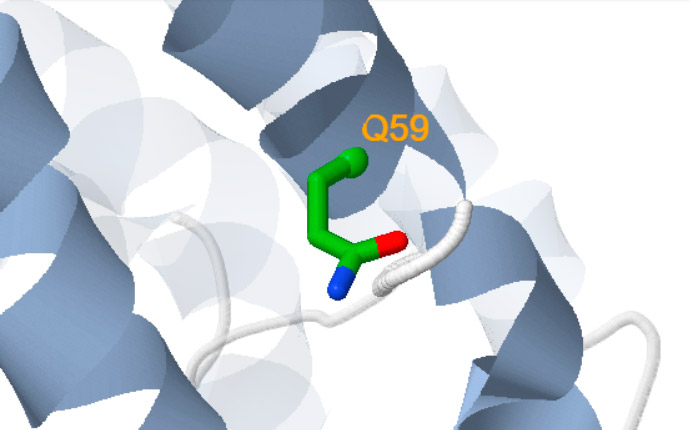
Besides, a new self-explanatory text appears indicating either the amino acid replaced (for missense variants) or the putative structural consequences triggered at the protein level (for nonsense or frameshift variants (Figure 1)).
Wherever an SNV button in Panel 2 is accompanied by an exclamation mark at its right, the affected residue is located in a missing part of the protein structure, and it is therefore not showable. When a
variant is selected in Panel 2, if the protein contains more than one chain, only one is emphasized in the Visualization Panel, the remaining chains being depicted with high transparency for the sake of a
clearer visualization.
Missense
Experimental structure (pdb: 6jbj): residues 2 to 606
The wild type residue highlighted in green is replaced in the variant.
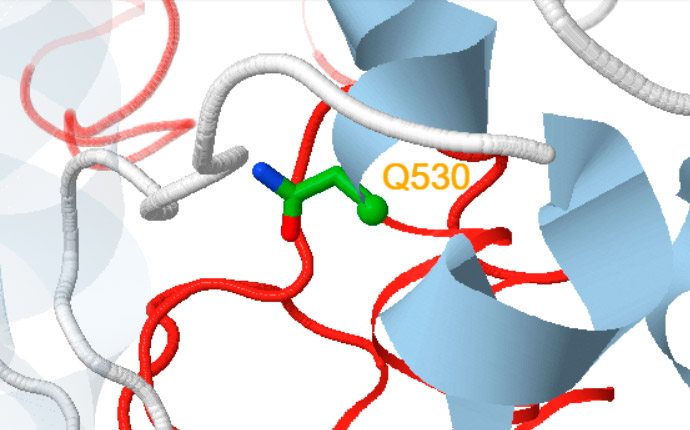
Nonsense
Experimental structure (pdb: 6jbj): residues 2 to 606
The variant will lack the red coloured region. As a consequence, the structure of the synthesized part may be quite different.
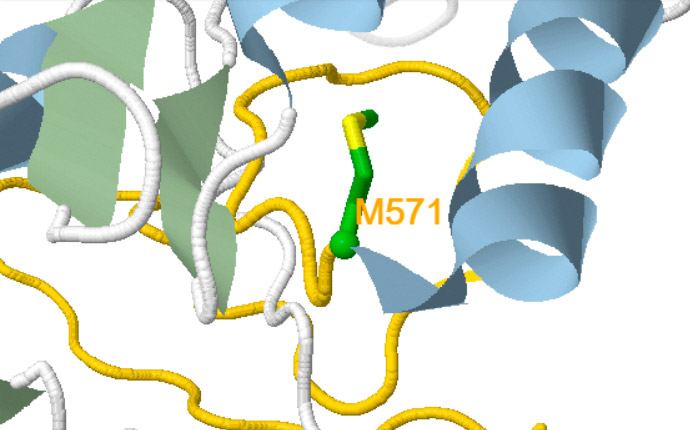
Frameshift
Experimental structure (pdb: 6jbj): residues 2 to 606
The structure of the gold coloured region is uncertain due to a complete change in sequence. As a consequence, the rest of the structure may be quite different.
Figure 1. Visualization Panel showing examples of the three different types of variants considered in PirePred, and their representation modes.
In addition, selection of an SNV by clicking in Panel 2 generates four new buttons in the Buttons Side Band, namely: ‘Predictions for this variant’ (
), ‘Structural context of this variant’ (), ‘Predictions for all
variants’ () and ‘ClinVar’ ().
‘Predictions for this variant’ button
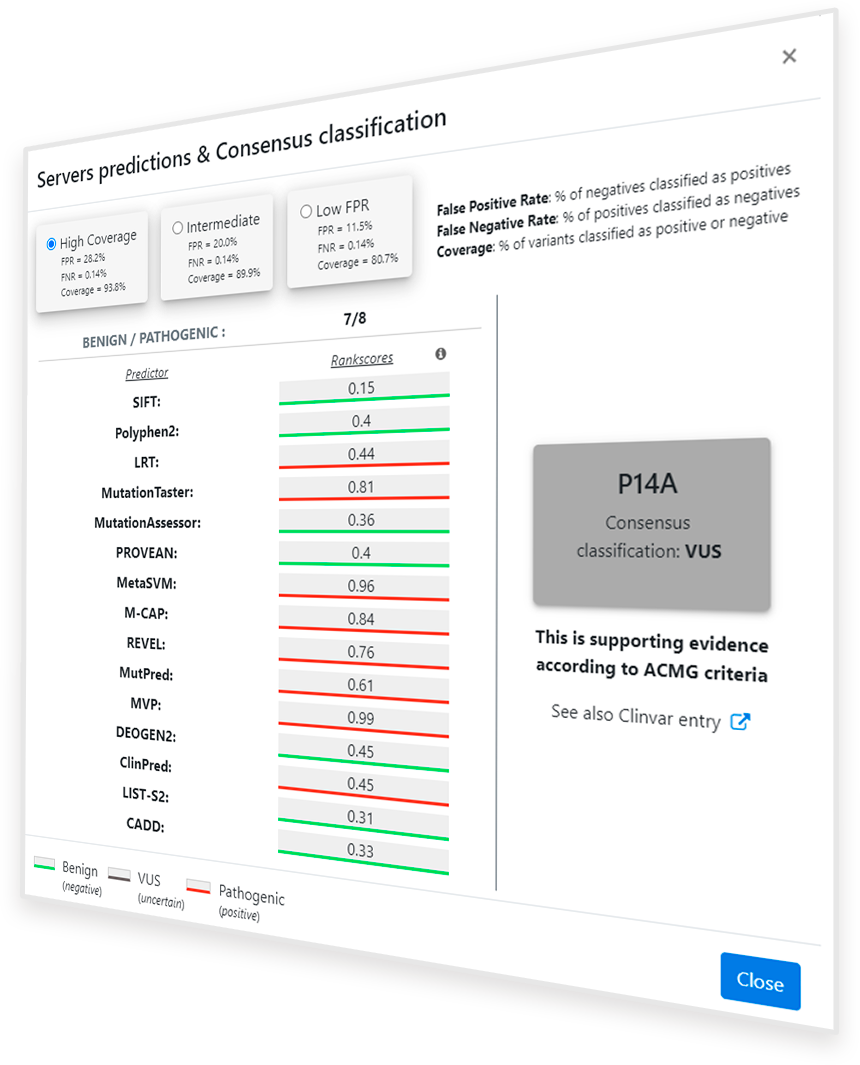
Once the ‘Predictions for this variant’ button ( ) is clicked, a pop-up window appears showing the available predictions for the
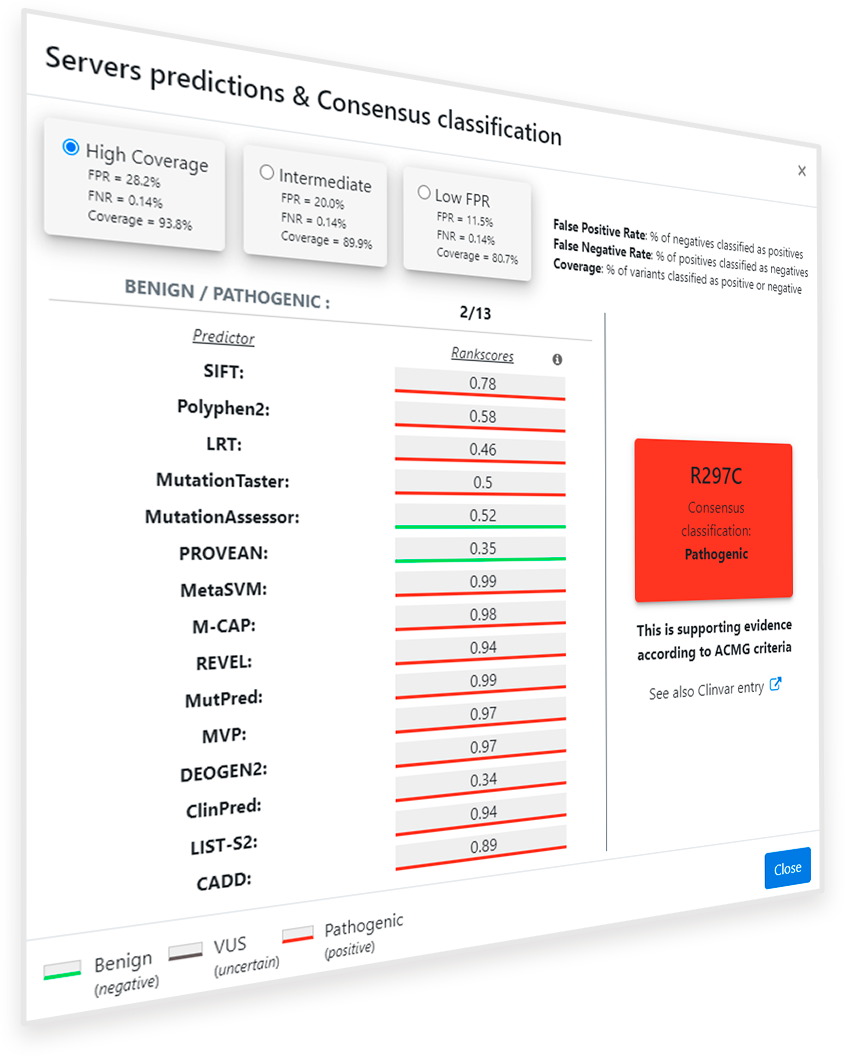
selected protein variant (Figure 2). On the right side of the window, a square with the summary of the prediction information is shown. It includes the protein variant name, in one letter amino acid
code, and the consensus classification, according to the method explained below. The color of the square also shows the consensus classification, being red for Pathogenic variants, green for Benign
variants and grey for VUS predictions. On the left side, the summary of binary predictors used (all included in dbNFSP 4.1a1), as well as the rankscores (values) and binary predictions
(underline color) thereof are shown in a scrolling column. Rankscores range from 0 to 1, being 1 the most probably Pathogenic score. Binary predictions are usually obtained directly from the scores,
but some predictors such as LRT incorporate extra information for the prediction.
As a guide for the user, we offer a summary of the predictions obtained following a simple 'Majority vote' algorithm, in which a variant is assigned to a class that is predicted by more than a given percentage of the methods, depending on the class. As it is based on predictions provided by different preexisting predictors, it would be difficult to guarantee that the results obtained from each individual predictor would be free from overfitting issues. However, a stratified group 5-fold cross-validation workflow has been performed in this case to discard possible overfitting issues in our classification method. Using reliable clinical data from ClinVar it is ensured an optimal level of statistical correctness in this consensus by having into account parameters such as accuracy, sensitivity, specificity, Predictive Value for Pathogenic variants (PPV), Predictive Value for Benign variants (NPV) or Matthews Correlation Coefficient (MCC).
Figure 2. Pop-up window after clicking the ‘Predictions for this variant’ button.
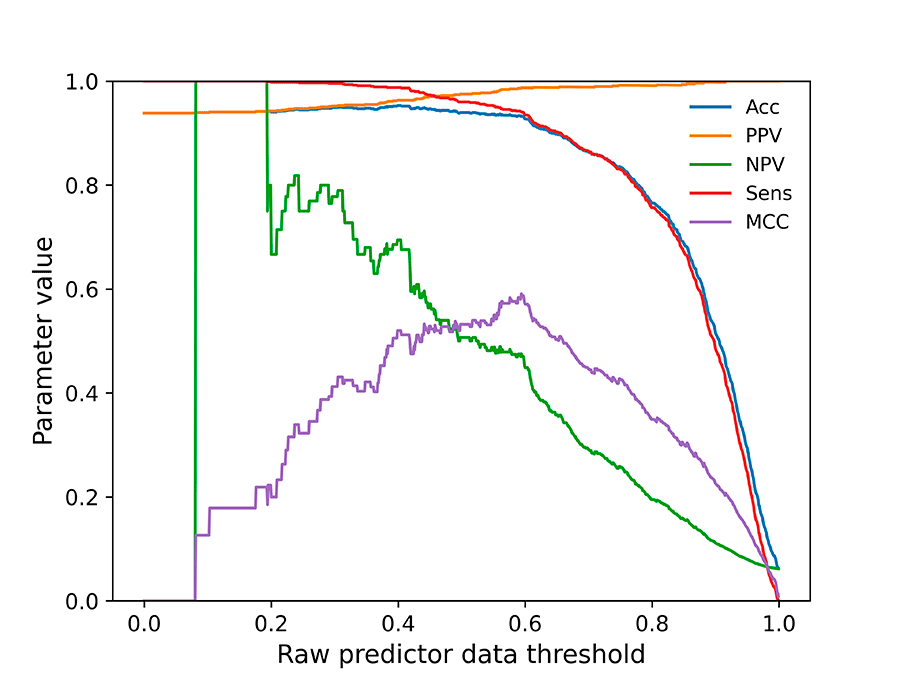
Figure 3. Parameters plot for threshold selection in the MutPred predictor.
For the four predictors without a pre-established threshold for binary prediction (REVEL, MutPred, MVP, CADD), their threshold has been selected, using plots as the one in Figure 3, to ensure an
optimal MCC value for the binary predictor while keeping its accuracy, sensitivity and PPV above 90% of the maximum value obtained for each parameter. NPV is not taken into account for the definition
of thresholds due to the low number of Benign variants.
In this server, the terminology Benign/Pathogenic is used to qualify the variants, as it is the most common among the included binary predictors. Pathogenic variants are those predicted to cause
or significantly increase the risk of developing a genetic disease. Some other terms in use referring to the same concept include disease-causing, damaging or non-functional. Benign
variants are those predicted not to affect (or even reduce) the risk of developing a genetic disease. Similar terms in use elsewhere include neutral, functional or polymorphism. Predictions
are unavailable for frameshift variants and for those that change a stop codon (X) for an amino acid coding codon, as their effect will depend more on the effect of the new sequence generated than on
that of the affected codon itself.
Apart from the default prediction mode ('High Coverage' button in Figure 2) two additional prediction modes have been setup in PirePred in order to adapt the performance to populations of lower prevalence: 'Intermediate' and 'Low FPR' buttons (see Figure 2).
The consensus classification returned to the user is calculated by two rules:
Nonsense variants are considered Pathogenic if more than 60% of the returned binary predictions turn out pathogenic. If not, the classification is considered VUS.
Missense variants are considered Pathogenic in 'High Coverage' mode if more than 60% of the returned binary predictions classify the variant as Pathogenic (more than 76% in 'Intermediate' mode and more than 92% in 'Low-FPR' mode). They are considered Benign if more than 70% of the returned
binary predictions label that variant as Benign. The rest of the variants are considered VUS.
The PirePred classification is computational supporting evidence (as defined by the ACMG guidelines2).
Table 1. ClinVar entries for the genes present in PirePred to date: 1st/June/2021.
Type
Number of entries
Relative to the total
All ClinVar
10052
100.00 %
Reviewed with 1+ star
7895
78.54 %
1+ star and not Uncertain or Conflicting
2424
24.11 %
1+ star and Pathogenic or Likely Pathogenic
2154
21.43 %
1+ star and Benign or Likely Benign
270
2.69 %
The Benign/Pathogenic heading shows the number of binary predictions of each type given by the individual predictors. For advanced users, the rankscore and binary prediction for each predictor are
offered, as obtained from dbNFSP 4.1a1. To derive them, the scores for a given predictor are ranked from least to most probably Pathogenic. The rankscore for a variant is then the fraction of scores under
its own score, thus ranging from 0 (most probably Benign) to 1 (most probably Pathogenic). All predictors in PirePred base their binary predictions in their scores, except LRT and Mutation Taster which
use additional information (homology, conservation…) for their predictions.
References:
1- Liu, X., Jian, X. and Boerwinkle, E., dbNSFP: A lightweight database of human nonsynonymous SNPs and their functional predictions. Hum. Mutat., 32: 894-899. (2011).
2- Richards S, et. al.. Standards and guidelines for the interpretation of sequence variants: A joint consensus recommendation of the American College of Medical Genetics and Genomics and the Association for Molecular Pathology. Genet. Med., 17: 405-24 (2015).
Quality metrics for the training dataset
Application of the ‘majority vote’ algorithm and the classification rules to the variants gathered from ClinVar (those with at least one star and not classified as ‘Uncertain’ or ‘Conflicting interpretations of pathogenicity’, see Table 1), provides a consensus classification of either Pathogenic or Benign for 93.8% of the variants. For these reliably annotated variants, PirePred consensus classification shows an accuracy of 96.5%, a PPV of 96.5%, a NPV of 96.7%, a MCC of 0.704, a sensitivity of 99.9%, a specificity of 53.4% and a FPR of 28.1%.
Quality metrics for an external dataset
The most stringent test a classifier should pass to avoid or at least reduce overfitting is that of showing at least a similar performance to that obtained on the training dataset but on variants whose Pathogenic or Benign character was not known at the time the classifier was trained. In other words, it means evaluating the prediction power on an external set.
The training/test set described in Table 1 and used to achieve the statistics above described was conformed by June 1st, 2021. Since then, by 19th July 2021, 224 new variants with the ‘1+ star and not Uncertain or Conflicting’ status were reported in ClinVar. They comprised 150 missense and 74 nonsense variants which were used to assess a real performance of PirePred and compare it to that shown by the 15 predictors selected for the consensus, and also to the prediction tools of the ACMG-inspired servers Varsome and Franklin.
The obtained quality metrics for this external set are shown comparatively in Table 2.
Table 2. Predictive statistics and quality metrics obtained by the PirePred consensus classifier, the 15 individual predictors selected from dbNFSP v4.1a1 and the in silico predictive tools from the ACMG-inspired platforms Varsome and Franklin.a
PirePred or Predictor
Accb
MCCc
PPVd
NPVd
Sense
Specf
FPRg (%)
FNRh (%)
Covi
PirePredj
Standard: High Cov
0.950
0.706
0.947
1.000k
1.000k
0.565
26.3
0.0k
0.893
Intermediate
0.973k
0.807
0.971
1.000k
1.000k
0.722
13.2
0.0k
0.835
Low FPR
0.988k
0.887
0.987k
1.000k
1.000k
0.867
5.3k
0.0k
0.732
Mutation Taster
0.897
0.580
0.890
1.000k
1.000k
0.378
60.5
0.0k
0.996
CADD
0.821
0.580
0.980
0.486
0.801
0.921k
7.9k
19.9
1.000m
LRT
0.847
0.451
0.908
0.543
0.908
0.543
42.1
8.6
0.933
ClinPred
0.968k
0.912k
0.975k
0.946
0.983
0.921k
7.9k
1.1
0.692
REVEL
0.847
0.572
0.830
1.000k
1.000k
0.395
60.5
0.0k
0.670
MetaSVM
0.840
0.538
0.844
0.818
0.964
0.474
52.6
2.2
0.670
LIST-S2
0.812
0.437
0.828
0.714
0.946
0.405
57.9
3.2
0.665
MVP
0.807
0.386
0.806
0.818
0.982
0.257
68.4
1.1
0.647
M-CAP
0.796
0.336
0.789
1.000k
1.000k
0.143
78.9
0.0k
0.656
PROVEAN
0.849
0.623
0.913
0.690
0.880
0.763
23.7
7.0
0.652
SIFT
0.801
0.498
0.876
0.610
0.852
0.658
34.2
8.6
0.652
DEOGEN2
0.857
0.606
0.890
0.742
0.924
0.657
31.6
4.3
0.625
PolyPhen-2
0.821
0.569
0.917
0.614
0.838
0.771
21.1
9.1
0.625
Mutation Assessor
0.830
0.552
0.881
0.676
0.890
0.657
31.6
5.9
0.603
MutPred
0.917
0.665
0.934
0.800
0.971
0.632
18.4
1.6
0.540
Varsome (in silico)l
0.933
0.657
0.929
1.000k
1.000k
0.500
36.8
0.0k
0.938
Franklin (in silico)m
0.912
0.500
0.909
1.000k
1.000k
0.286
26.3
0.0k
0.509
a Variants (224) newly released in ClinVar (classified as Likely Benign, Benign, Likely Pathogenic or Pathogenic, with Review status of one or more stars: https://www.ncbi.nlm.nih.gov/clinvar/docs/review_status/) released after the full training and evaluation of PirePred. 43 out of the 58 genes analysed in PirePred represented in this external set. Pathogenicity verdicts accessed by July 19th, 2021 (https://www.ncbi.nlm.nih.gov/clinvar/). b Accuracy: Acc = (TP + TN) / (TP + FP + TN + FN). It represents the percentage of correct predictions out of all binary predictions. c Matthews Correlation Coefficient: MCC=((TP×TN-FP×FN))/√((TP+FP)×(TP+FN)×(TN+FP)×(TN+FN)). d Positive Predicted Value: PPV = TP / (TP + FP) is the fraction of Pathogenic predictions corresponding to Pathogenic variants; Negative Predictive Value: NPV = TN / (TN + FN) is the fraction of Benign predictions corresponding to Benign variants. e Sensitivity: Sens = TP / (TP + FN). f Specificity: Spec = TN / (TN + FP). g False Positive Rate: FPR = FP / Negatives = FP / (TN + FP + UN). Expressed as %. h False Negative Rate: FNR = FN / Positives = FN / (TP + FN + UP). Expressed as %. i Coverage: fraction of variants in the dataset (224) that are classified as Benign or Pathogenic (i.e. those not classified as VUS or unpredicted). j The PirePred server classifies variants using thresholds (P-to-VUS and VUS-to-B) based on the fraction of Benign predictions recovered for the variant. The P-to-VUS threshold for missense variants can be modified to increase specificity at the expense of coverage. PirePred achieves maximal coverage in Standard mode using the standard P-to-VUS threshold of 0.4, whereas in Intermediate and Low FPR modes predictions are issued using P-to-VUS thresholds of 0.24 and 0.08, respectively. k Maximum (or minimum in the case of FPR and FNR) values highlighted (underlined) for each of the quality metrics obtained for PirePred and the listed predictors (per column). Best values obtained by PirePred (High Coverage) are highlighted in bold font. l Varsome server, https://varsome.com/, last accessed November 20th, 2021. m Franklin server, https://franklin.genoox.com/, last accessed November 20th, 2021.
Structural context of this variant
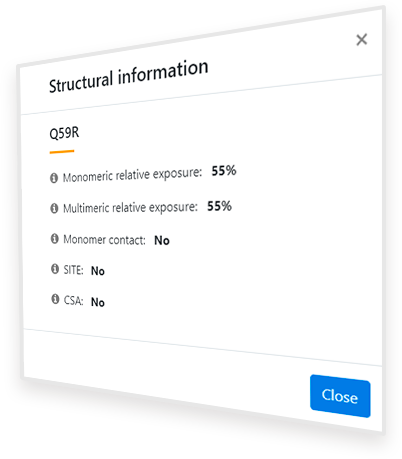
After clicking the ‘Structural context of this variant’ button ( ), a popup window like that shown in Figure 4 appears, which contains information relative to the structural context of the affected residue. Under the variant name, five properties of its structural context are given. When hovering over each of these properties, an explicative text box appears. The explanation of each field is the following:
Monomeric relative exposure: Solvent exposure of the residue in the isolated monomer of the protein relative to the average exposure of that residue type in the unfolded state
Multimeric relative exposure: Solvent exposure of the residue in the biological assembly of the protein (as shown in the Structure Visualization Panel) relative to the average exposure of that residue type in the unfolded state
Monomer contact: Presence of the residue in a probable interaction surface between monomers of the protein according to the displayed PDB structure or model
SITE: Presence of the modified residue in a region annotated as a ‘SITE’ in the PDB file. If it is present, the residue is part of a relevant (cofactor binding, catalytic, assembling) site of the protein and, therefore, the variant may drastically reduce the activity of the protein
CSA: Presence of the modified residue in the Catalytic Site Atlas (CSA). If it is present, the residue is part of the catalytic site of the protein and, therefore, the variant may drastically reduce the activity of the protein
Figure 4. Pop-up window after clicking the ‘Structural context of this variant’ button.
Monomeric/multimeric relative exposure indicates the percentage of the residue that is exposed in the native protein (in the monomer or the biological assembly, respectively) compared to the average exposure of that type of residue in the unfolded state. Values over 100% show that the residue is overexposed and under 15-20 % show that it is buried according to Ayuso-Tejedor et al.2 (the lower the value, the more significant the burial). A significant reduction in the relative exposure from the monomer form to the biological assembly means that the residue is buried in the biological assembly and, therefore, may alter the interaction of the constituent subunits if changed. Thus, if the ‘Monomer contact’ property shows ‘Yes’, this change is significant (the multimeric exposure is less than 90% of the monomeric exposure) and the variant is potentially Pathogenic as it might be unable to correctly form its biological assembly.
SITE and CSA indicate whether the residue is annotated as relevant for the function of the protein (checked experimentally or by homology) in the original PDB file or in the Catalytic Site Atlas database, respectively. Thus, if the value of any of them is ‘Yes’, the residue is likely relevant for the function and any variant may cause malfunction and, therefore, disease. If their value is ‘No’, it doesn’t mean that the residue is not relevant, but only that it hasn’t been found as relevant with significant proof or that it hasn’t been annotated as such.
References:
3- Ayuso-Tejedor, S., Abián, O., & Sancho, J. Underexposed polar residues and protein stabilization. Protein Engineering, Design and Selection, 24(1–2), 171–177. (2011).
‘Predictions for all single amino acids variants’ button
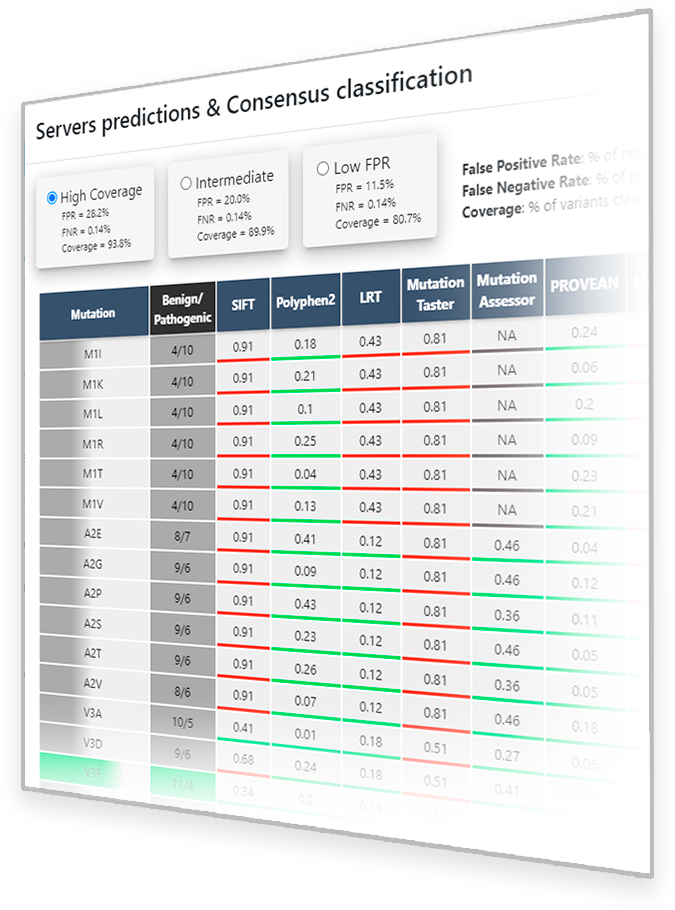
When clicking either the link over the text 'see all possible variants' in the Variants Panel or the ‘Predictions for all single amino acids variants’ button ( ) in the Buttons band (at the right-hand part of the server screen) a popup window shows (Figure 5) all possible protein variants that can be produced by SNVs in the coding gene, together with their predictions as retrieved from dbNFSP 4.1a, and the consensus classification given by the PirePred server. The rows contain the same information as the columns in ‘Predictions for this variant’ with the only additional information of the coloring of the first two columns. The first column is colored with the corresponding consensus classification, obtained as indicated before. It is filled with color up to the percentage of predictors that agree with the consensus out of the 15 total predictors or, for VUS classifications, with the average between the numbers of Benign and Pathogenic predictions. The second column is completely colored with the corresponding consensus classification.
The interpretation of the results is the same as in ’Predictions for this variant’, the only changes are the display position and the fact that the results are provided for all possible variants instead of just one of those present in ClinVar.
Figure 5. Pop-up window after clicking the ‘Predictions for all single amino acids variants’ button.
On the structures shown in the Visualization Panel
Of the 58 proteins encoded by the genes included in the PirePred server, 41 have experimentally determined structures available in the Protein Data Bank (PDB) with a reasonable structural coverage. However, in two of them the coverage is not so high and the experimentally solved fragment has been combined with a modeled fragment of the missing part of the structure obtained in one case from the GPCR-SSFE 2.0 server3 (multi-template homology modeling) and in the other case from the i-Tasser server4 (threading). The remaining 16 structures have been obtained (homology modeling) from the Swiss-Model server (single-template homology modeling)5.
Ten of these models were retrieved directly from its repository, while models for the remaining six proteins (of which either there was no reported model or the reported ones had low quality parameters) were built de novo. The models retrieved from the repository were chosen from the list available for each gene, based on the criterion of having the highest possible coverage and Qmean (integrated quality parameter), but also looking for a template matching the right oligomerization state predicted or stated for the protein. The same criterion was applied to select the best template for the six models built.
References:
4- Yang, J., Zhang, Y. I-TASSER server: new development for protein structure and function predictions. Nucleic Acids Research, 43: W174-W181 (2015).
5- Worth, C. L., Kreuchwig, F., Tiemann, J. K. S., Kreuchwig, A., Ritschel, M., Kleinau, G., Hildebrand, P. W. and Krause, G. GPCR-SSFE 2.0—a fragment-based molecular modeling web tool for Class A G-protein coupled receptors. Nucleic Acids Res. 45(W1), W408-W415 (2017).
6- Waterhouse, A., Bertoni, M., Bienert, S., Studer, G., Tauriello, G., Gumienny, R., Heer, F.T., de Beer, T.A.P., Rempfer, C., Bordoli, L., Lepore, R., Schwede, T. SWISS-MODEL: homology modelling of protein structures and complexes. Nucleic Acids Res. 46(W1), W296-W303 (2018).
Example of use
Choose gene PAH in the Main Selection Panel (Animation 3) and then the R297C variant from the Variants panel. The Visualization Panel focuses on the residue (arginine 297) affected by the variant selected. Only one representative subunit (chain) of the tetrameric protein (the enzyme phenylalanine-4-hydroxylase) is ordinarily shown, the representation of the three others being set to a higher transparency for greater clarity.
Many different operations, e.g. selecting neighboring residues, performing distance calculations, etcetera, can be done using the Visualization Panel (right click opens an interactive menu for performing additional operations in JSmol for advanced users). As R297C is a missense variant, only the original residue (R297) replaced as a consequence of the genetic variant is highlighted (by depicting in green its alpha-carbon atom −as a small sphere− and the sidechain in stick representation). Had the variant been nonsense or frameshift, the C-terminal part of the protein starting from the variant point would have been emphasized by showing it in a slightly different backbone representation (ribbon) and in the same color coding used in the corresponding variant button at Panel 2 (red and gold, respectively, for nonsense and frameshift variants).
Animation 3. Interactive panels showing the selection of the missense variant R297 of the PAH’s protein: phenylalanine-4-hydroxylase.
In nonsense variants, the red-colored region defines the segment that will not be synthetized because of the presence of a STOP codon in the mRNA whereas, in frameshift variants, the golden ribbon defines the segment that will contain a massively changed amino acid sequence as a consequence of a frameshift at the mRNA level, which can also change the length of the segment (see Figure 1 in 'Main selection panel' tab).
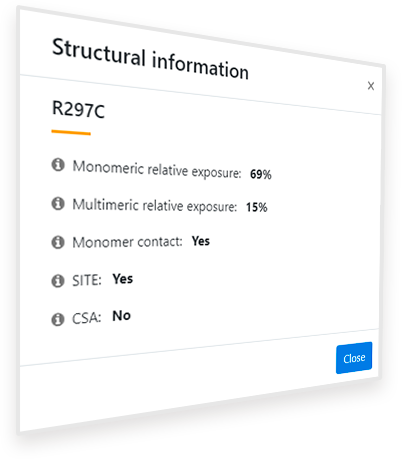
Figure 6. Pop-up window after clicking the button ‘Structural context of this variant’ for the variant R297C of the gene PAH.
Clicking in the ‘Structural context of this variant’ button ( ) provides additional information that, in some cases, may help to understand why the variant is or is not Pathogenic (Figure 6). For the R297C variant in the PAH gene, the information retrieved indicates that there is a significant reduction in the relative exposure of the residue in the monomer (69%) when it is associated to the other monomers in the biological assembly (15%), which means that the residue is probably located in the interaction region between the monomers. This is confirmed by the ‘Monomer contact’ property, which indicates ‘Yes’. Thus, replacement of R297 by a different residue may hinder the correct assembly of the protein and so its function. Moreover, the fact that the residue appears in a region annotated as part of a SITE in the PDB (‘SITE: Yes)’ suggests that an amino acid change such as a replacement of an Arginine by a Cysteine, may drastically modify the activity of the protein.
Figure 7. Pop-up window after clicking the button ‘Predictions for this variant’ for the variant R297C of the gene PAH.
Clicking on the ‘Predictions for this variant’ button activates a popup indicating that 2 out of 15 servers predict this variant as Benign, while 13 predict that it will be Pathogenic. The PirePred consensus classification obtained for this variant by applying the classification rules explained above is ‘Pathogenic’ (Figure 7).
These structural aspects can be checked in situ in the Structure Visualization Panel by rotating/zooming the protein and guessing how such a modification may alter –at least locally− the native arrangement of amino acid residues in its surrounding.
If the user is interested in the predictions offered for a SNV in the PAH gene that is not reported in ClinVar (anyone that doesn’t appear in the Variants Panel, [2] in Animation 2 in 'Main selection panel' tab), clicking in the ‘Predictions for all single amino acids variants’ button display a larger table where the variant of interest can be found together with the corresponding individual predictions by the 15 predictors, and the PirePred consensus classification.
Server Implementation
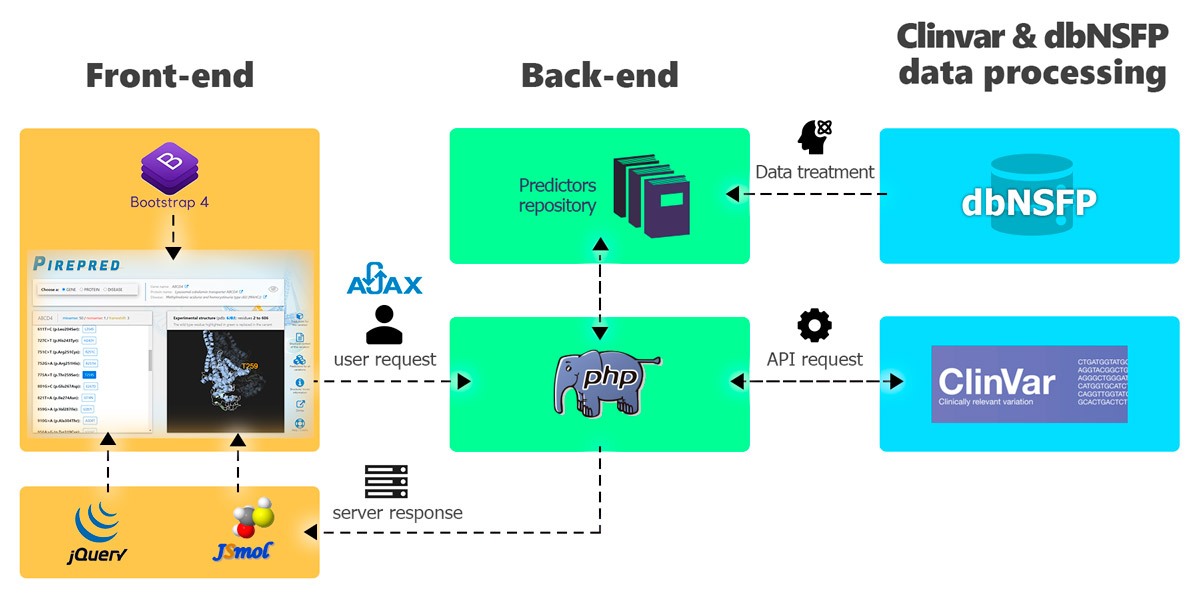
Figure 8. Scheme showing an overview of the PirePred web server implementation and the technologies employed.
The website uses Bootstrap 4 for the presentation in the client side (front-end). The user selects a gene, protein or disease and, through AJAX, the request is made to the server. Then, in the back-end, PHP connects with the ClinVar API and obtains the data query in XML. These are formatted and displayed in a list. Moreover, the protein structure related to the selected entity (gene, protein or disease) is shown through the open-source JavaScript viewer JSmol. Also, pre-generated tables with predictions for all the real and potential variants of each gene caused by a SNV are obtained from the dbNFSP 4.1a repository. All this information is returned to the user through the interface.
Website's browser compatibility
An updated browser is recommended and JavaScript must not be disabled. Table 2 below shows the PirePred’s compatibility with the most extended browsers used with the Operating Systems (OS):
OS
Version
Chrome
Firefox
Microsoft Edge
Safari
Internet Explorer
Linux
Ubuntu 16.04
45
38
n/a
n/a
n/a
MacOS
10.11
45
38
n/a
9
n/a
Windows
7
45
38
12
n/a
10
Table 3. PirePred’s browsers compatibility.
Identified sequence issues
In genes BTD, CYP21A2, HPD, IVD and TGFB1 there are some mismatches −wrong numbering or amino acid(s) changed− between the ClinVar protein sequence displayed in PirePred and the UniProt reviewed canonical sequence. In TSHR, there is one mismatch in a segment that is not part of the solved structure shown in the ‘Structure Visualization panel’.
In genes ABCD4, ACADM, ACADS, ASL, BCKDHB, CFTR, CYP21A2, FCGR2A, GALT, MMUT, MTHFR, PAH and TGFB1 the original experimental structure of the protein in the PDB or the initial structure modeled contained mutation(s). They all have been modeled back into the corresponding wild type ClinVar canonical sequence.
In genes BCKDHA, BCKDHB, BTD, CYP21A2, FCGR2A, GCDH, IVD and TGFB1 the structure shown in the ‘Structure Visualization panel’ has been renumbered to match the ClinVar canonical sequence.
In gene HPD predictions for variants in residues 1-39 are unavailable because the sequence used by dbNFSP 4.1a lacks that segment.
About PirePred
The PirePred server was designed and implemented by J. J. Galano-Frutos, H. García-Cebollada, A. López and J. Sancho, with contributions from J. Fernández-Recio and X. de la Cruz. Address correspondence to jsancho@unizar.es.
The PirePred server is described in the following publication:
Galano-Frutos JJ, García-Cebollada H, López A, Rosell M, de la Cruz X, Fernández-Recio J, Sancho J. (2022). PirePred: An Accurate Online Consensus Tool to Interpret Newborn Screening-Related Genetic Variants in Structural Context. J. Mol. Diagn. 24(4): 406−425. DOI: 10.1016/j.jmoldx.2022.01.005
Disclaimer. This resource is intended for research purposes only. As indicated, PirePred classification is computational supporting evidence as defined by the ACMG guidelines2. The authors are not responsible for its use or misuse and assume no liability or responsibility for any error, weakness, incompleteness or temporariness of the resource and of the data provided.